Skill 8C
Reading a Bar Graph
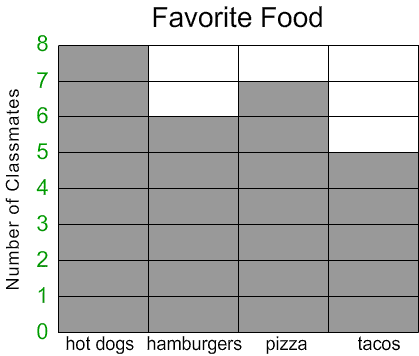
A bar graph is often used to
show the quantity of something and provides a quick visual comparison to
other things in the graph. You can have a vertical or horizontal bar
graph. Here we want to determine if your student understands the
layout and logic of a vertical bar graph. Each column represents a
type of food that students called their "favorite." The number to
the left of the graph represents "how many" students called that food
their "favorite." Read the "red" text below the graph.
Gene
asked his classmates to vote for their favorite food.
He put their votes
in this bar graph.
Answer the questions I ask you about the graph.

| 1. How many classmates chose pizza? |
| 2. How many classmates chose hot dogs? |
| 3. How many classmates chose tacos? |
| 4. How many classmates chose hamburgers? |
| 5. How many more classmates chose hot dogs than pizza? |